Description
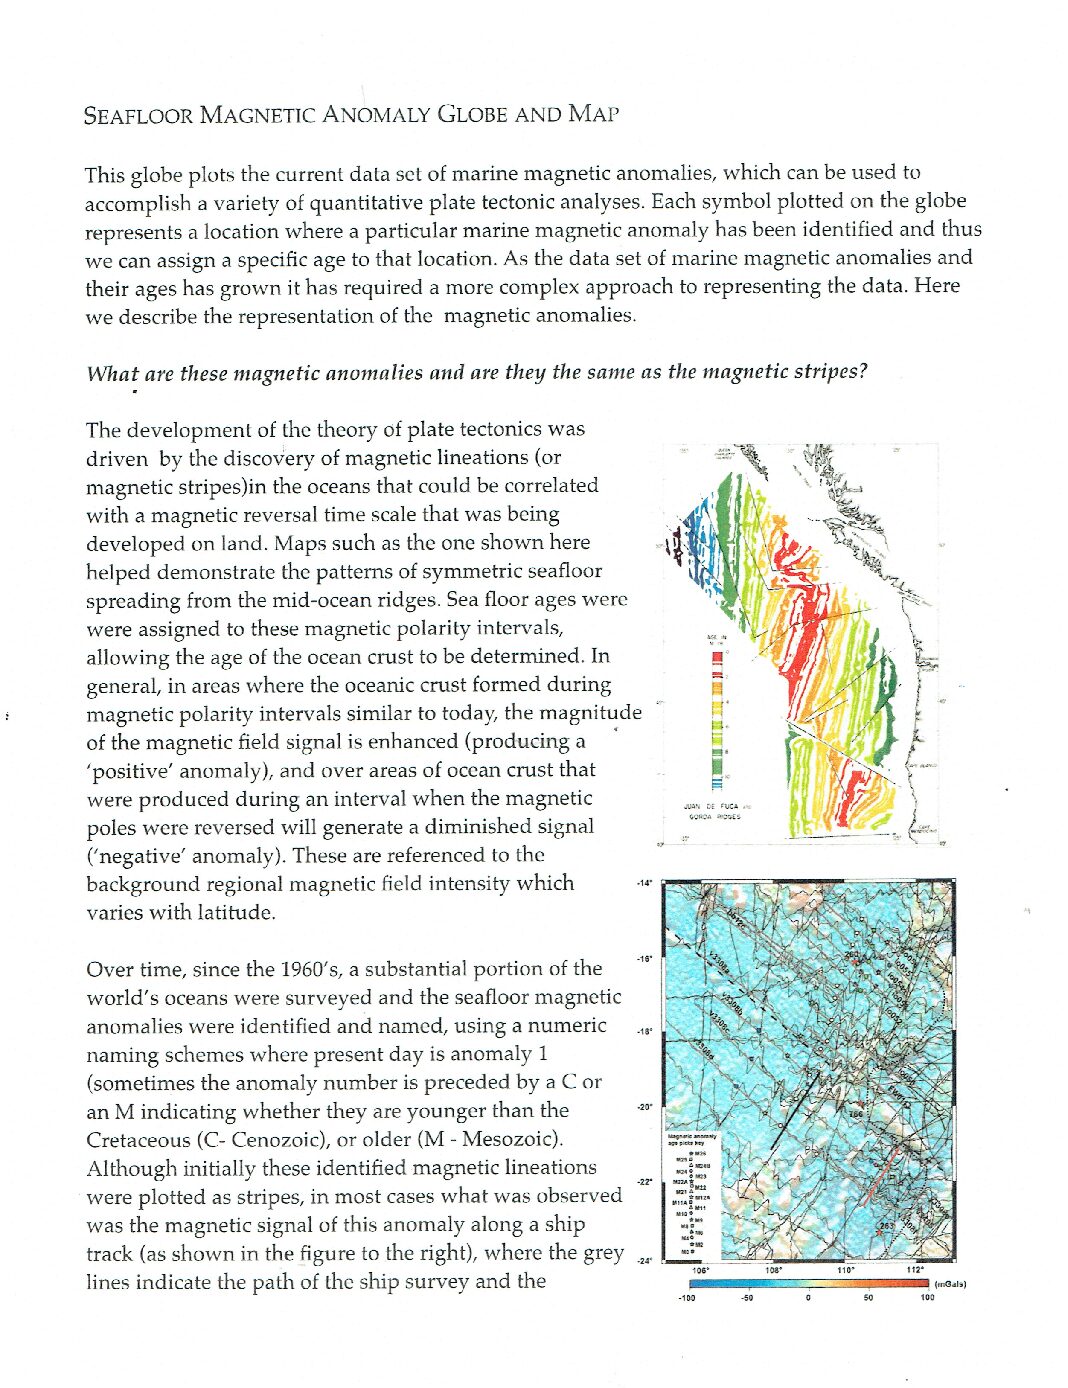
The map plots the current data set of marine magnetic anomalies, which can be used to accomplish a variety of quantitative plate tectonic analyses. Each symbol plotted on the globe represents a location where a particular marine magnetic anomaly has been identified and thus we can assign a specific age to that location.
The motivation for development this globe was a perceived need for accurate magnetic anomaly data to be used in hands-on projects helping students develop a better understanding of core concepts of plate tectonics.
We hope to provide students with tools to help them (1) improve their understanding of plate tectonics on a sphere, (2) correlate this understanding to its representation on more standard media such as Mercator maps and (3) develop an intuitive understanding of these processes.
Educational Approach
We have designed these globes to be usable across a range of educational levels. They are designed to be accessible to Middle/High School students, but also provide the precision and completeness to allow them to be used by upper-level Geography at college-level. Our experience is that even graduate students have found the globes to be the preferred vehicle for initial estimates of rotation parameters, before refining their data using the maps and mathematical analyses. – Kevin Furlong at Pennsylvania State University
Intrinsic to plate tectonics are a range of concepts that revolve around plate motions on a sphere, including rotation poles, angular velocities, and plate boundary kinematics. These concepts were key components in the development of plate tectonic theory, and serve as the underlying quantitative foundation for much of our understanding of plate interactions.
However, in spite of this underlying importance, these concepts remain difficult for students to grasp and quantitatively implement; in part because we often attempt to teach and subsequently use these spherical kinematics (awkwardly) using maps.
In general, globes currently available can be useful for learning these concepts, but are difficult to use in a rigorous manner that allows students to develop an intuitive understanding of plate kinematics, quantify that understanding, and develop the skills to transfer that understanding to comparable data in the more typical map representation. Here we present our approach to addressing this problem – (1) the development of a globe representing the current distribution of marine magnetic anomalies, (2) a comparable map, and (3) examples from a series of learning activities that utilize this global data set to help students discover and understand fundamental processes of plate motions and plate interactions.
Such foundational plate tectonic concepts as rotation poles, angular versus linear velocity, small circles and great circles are all easily envisioned using this explicitly global model and data set. The incorporation of the complete set of marine magnetic anomalies allow these activities to be useful for a range of students from Middle-school through University-level. Importantly students can compare observations and measurements they make on the globes with calculations they do utilizing map data and standard plate motion tools. The globes can be annotated using dry-erase markers, and measuring distances, angles, and orientations on the globe is relatively straightforward.
Magnetic Anomaly Data
The globe plots the current catalog of magnetic anomaly identification and location picks from the global database GSFML (The Global Seafloor Fabric and Magnetic Lineation Database Project; http://www.soest.hawaii.edu/PT/GSFML/) Anomalies are color coded for correlation to their specific anomaly, and symbols indicate if they represent the young (solid) or old (open) edge of the anomaly. These anomalies can be linked to any current Magnetic Anomaly Time Scale. The base for this globe (and map) is a detailed ocean bathymetry and Fracture Zone data (from GSFML) to help users link anomalies to Mid-Ocean Ridge segments and Transform Faults
Example Education Activities
How do Plate Rotations Work?
The evidence of seafloor spreading and plate rotations given by the Atlantic magnetic anomalies provide ideal data to explore basic properties of plate rotations – including angular velocity, small circles/great circles, etc. AUS/ANT Pole
In this activity students were provided with the location of the North America – Africa pole and then tested such concepts as angular velocity, plate velocity with distance etc.
Although all of these concepts could be tested using the map, they require significant calculations and cannot be done directly.
Plates Really Are Rigid
A core concept in plate tectonics is that plates act as rigid bodies whose motions can be described by rotation about a fixed point (pole). Students test these concepts using the relative motions of the Australia and Antarctic plates. On the map, because of the effects of map projection, there does not appear to be a common rotation pole for the entire plate boundary. However, when analyzed using the globe it is easy to use the anomalies to determine the rotation pole (in NE Africa) and estimated rotation rates, linear velocities etc.
Acknowledgements
Roubal Mapping, Pennsylvania State University


